
An eye in the sky for wind turbines
[Microsoft Azure] [Power BI] [Python] [Docker]
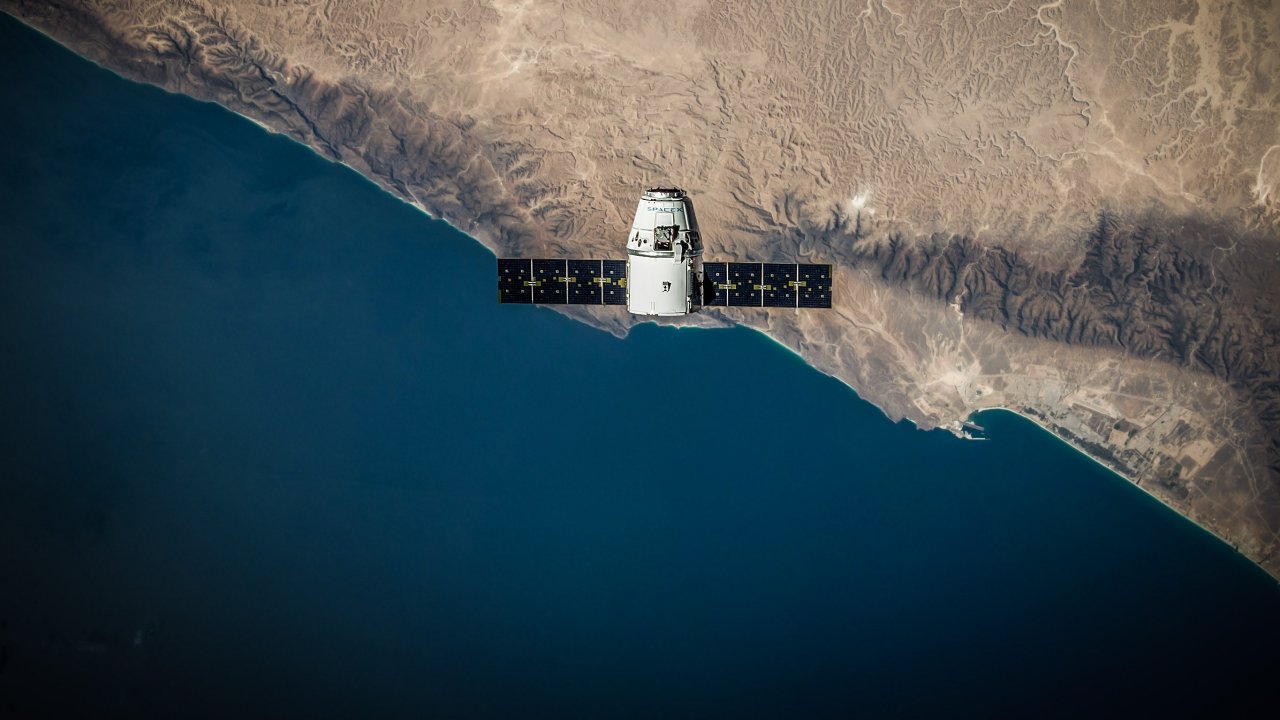
As you’re reading this, satellites are circling the planet and capturing images of the surface. It’s these very images that we’re now accessing, downloading and processing to gain new insight - all so we can know which way our turbines are facing.
The idea was brought to life by Nenad Keseric and Richard Hall. While Nenad has domain knowledge from operating wind farms in our New Energy Solutions department, Richard has extensive experience working with satellite images. The old clichè of teamwork making the dream work is true for satellites as well:
“You need three parts to succeed with a project like this. You need someone who understands the problem solving by adding new data content, a programmer who can manage and manipulate the data and a user who can make use of the output,” Richard explains.
“This project has been an exciting collaboration with several skilled colleagues and stakeholders all working to push it forward,” Nenad adds.
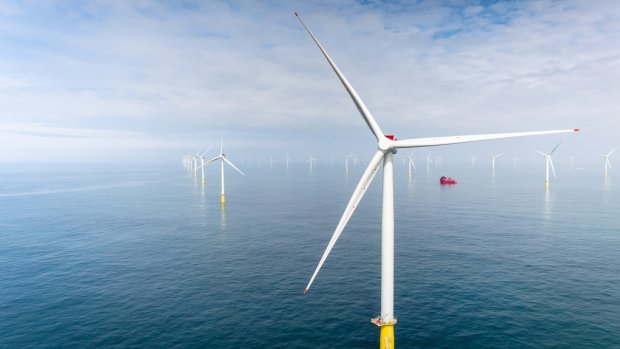
But why does it matter which direction the turbines are facing? Imagine a skier racing down hill and adjusting his positioning to maximize power – the same reasoning applies to wind turbines
Nenad understood that if wind turbines are not facing in the right direction, they’re not utilizing their full potential. So, how could satellite data solve this and how does it actually work? Let’s head into the world of software to find out.
“While they wanted to measure the turbine positions, the real challenge didn’t become clear until they asked “how can we measure them all at the same time?”. That’s when it became obvious that satellites were the way to go,” Richard say
How it works
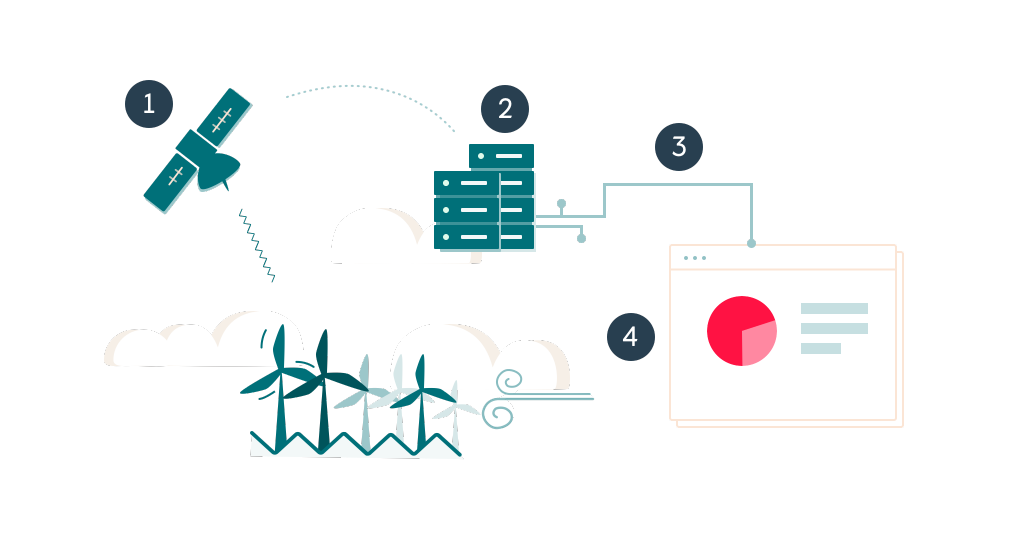
(1) ESA’s Sentinel-1 satellites orbit the Earth capturing SAR images.
(2) Then, these images are downloaded. Since they’re radar images and taken at an angle they need to be processed.
(3) The processed images are downloaded and the direction of the wind turbine (yaw) is estimated.
(4) This measurement is put into a dashboard, where you can look at other data like the date, time and wind speeds, to verify the results. Then, we might be able to tell which turbines need adjusting to perform even better.
Analyzing the final frontier
But what do you do to get access to satellite images? It might sound like you’d need a whole lot of funding, while in fact it’s all free to use. The European Space Agency’s (ESA) Copernicus programme actually let’s you register and then download the images you want.
“Previously, we had to order specific images and pay for these but now they’re free. The tech we use has also improved greatly the last few years, and this wouldn’t have been possible 5-10 years ago,” Richard says. “It’s really about data democratization and we were in a position to take advantage of that,” he adds.
So far, they had the idea and the satellite know-how in place. But to code it all and make it happen they needed a suitable team of developers. And who better to task with the job of processing the images than Software Innovation?
After all, we’ve got the Green Team dedicated to working with renewable energy. When they were asked, developer and keen photographer Hallgeir Holien naturally volunteered – and got the job.
“The project naturally caught my attention as a photographer. But it’s also great example of how flat the power structure in our team is. We’ll list prioritized tasks and then you can pick and choose what you want to work with.”
Hallgeir Holien
“It’s very motivating to choose the project yourself, you get a completely different sense of ownership to the problem. And of course it’s pretty cool to be working with satellites,” he adds.
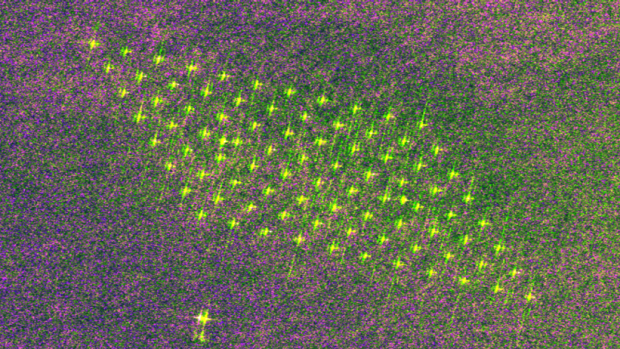
There were some challenges to the project as he began working on it. The biggest difference between satellite images and photographs as we know them, is that these satellite images are radar images. There are no RGB colors but it’s about horizontal and vertical polarization.
“The images are also taken at an angle. They don’t look like traditional maps so it’s difficult to pinpoint the wind farms. I had to transform the images to make them fit into a traditional system of coordinates,” Hallgeir says.
Algorithm after algorithm
What’s the first step when you have a question in our day and age? You head to the internet and ask around.
“My first step was basically to read documentation, ask around on the ESA forums and giving different ideas a try. Eventually, I figured it out and then the next step was to create an input list containing all the wind turbine coordinates,” he says.
This input list enables the system to send a request to ESA for images of certain coordinates. Then, after downloading the images and processing them further it’s starting to look more like traditional image editing.
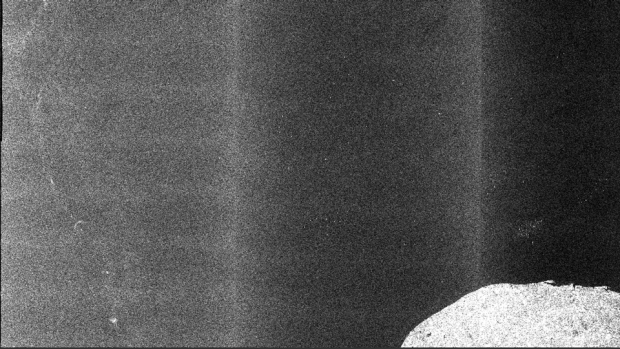
“What we see on the images is something that looks like a dashed line creating an ellipse. Then, we use a library to estimate the axis – which is what we believe to be related to the yaw of the turbines”. It’s all one algorithm after another, with each problem having its own library and ways of doing it,” Hallgeir explains.
Meet our wind farms
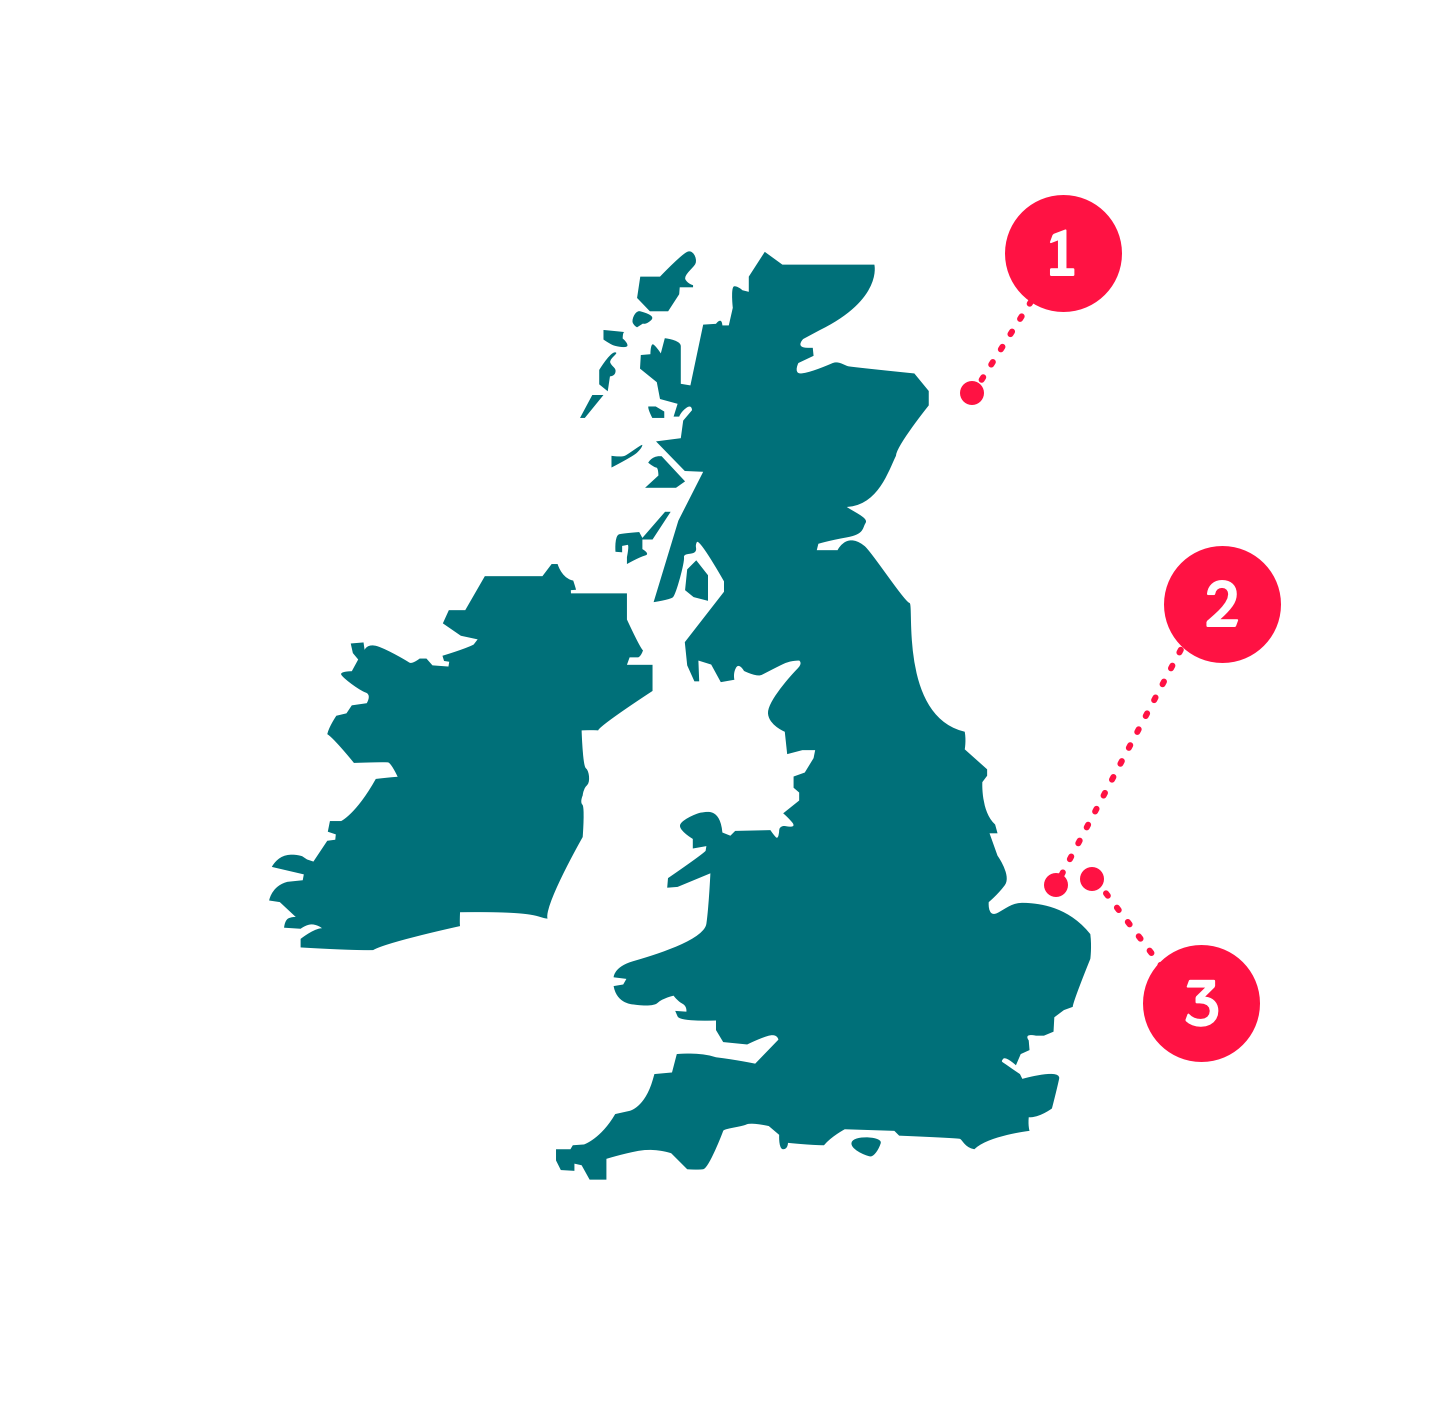
1. Hywind
- Located off the coast of Peterhead, Scotland
- 5 floating wind turbines
- Covers 4 km2
2. Sheringham Shoal
- Located off the coast of Norfolk, England
- 88 wind turbines
- Covers 35 km2
3. Dudgeon
- Located off the coast of Norfolk, England
- 67 wind turbines
- Covers 55 km2
All about automation
When Hallgeir went on to a new project, Thomas H. Thoresen picked up the mantle and continued work together with Thibaut Forest in agile sprints. The team were given a rather short deadline before the summer of 2018 to make a working pilot.
“We got a deadline of 2-3 weeks. Even though it was a little stressful it was mostly positive, and we were very productive during that time. Having a defined goal and a short deadline has its upsides,” Thomas laughs.
With most of the algorithm work having been done, Thomas’ task was mainly focused on getting the same code to run smoothly in the cloud. Several algorithms and datasets had to work together for it to function as intended.
"It’s a great feeling when you can see the end result of all the different parts, from downloading data to transcribing photographs, working together like it’s supposed to. That makes all the work worth it."
Thomas H. Thoresen

The radar images proved a little more challenging to analyze. The turbines are shown as bright spots on the image, and the biggest spots are thought to be the turbines. It can be difficult to know for certain that the biggest spots are in fact the turbines, but the idea is that the dashboard tool will help them decide.
Using the dashboard, the user can incorporate wind directions, power output and other types of data to get a bigger picture.
Seizing opportunities
Even though the current focus is estimating the direction of the wind turbines, the project can expand into something bigger. Right now, an early prototype of the dashboard is available within Equinor’s own app store.
“As we enter into a digital world we have to be careful so we don’t overload the user with data. Our staff at Sheringham have been giving us feedback, which is an important part of avoiding that possible overload,” Richard says.
Nenad believes the tool can help us operate our wind farms in a smarter way and maybe even help increase production.
"We are hoping to integrate even more input and data into the dashboard in the future. I think that will help operate our wind farms in a smarter way and even help increase production."
Nenad Keseric
Who knows what the future holds? One thing is certain however – if you want to stay in the Loop on what Software Innovation is up to next you should subscribe below.
Want to stay updated on Loop?
People

Vidar Slåtten

Thibaut Forest
Marita Midthaug

Hallgeir Holien
.jpg.transform/large/image.jpg)
Nenad Keseric
Thomas Hjelde Thoresen
Richard Hall