
Fo.tone - a journey of sound
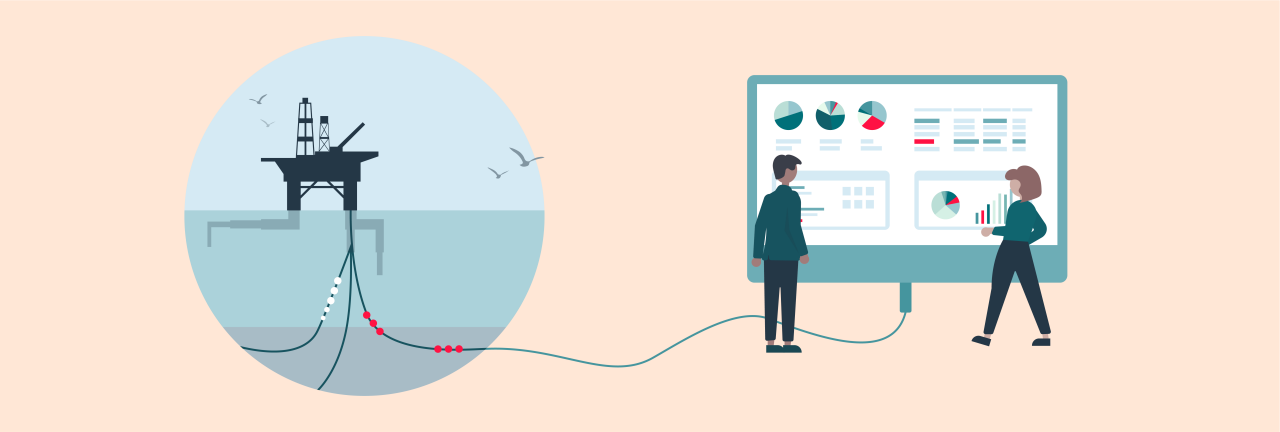
Thanks to engineering, data engineering and software development, we can use fiber optic cables to livestream sounds from the subsurface, hundreds of kilometers out at sea. Let's meet Fo.tone!
Listening to these sounds means we can reduce downtime on our wells and run them more efficiently. It’s been a dream for quite some time, and when the Fo.tone-team started in 2019 it had been seemingly out of reach.
“We had to create a minimum viable product in a matter of months at a time when no one had succeeded in doing this before. We knew what we had to do, but not how to do it."
Kjetil Tonstad, Fo.tone team lead
Fast forward to 2021 and here’s Fo.tone: a web app that handles live stream data from offshore fiber optic cables, presents it in a display with other wellbore data and enables a whole new world of information.
“Although we were an experienced team, everyone’s had a steep learning curve along the way, and I’m very proud of how far we have come as an agile team. We have gone all the way from just being tasked with creating an MVP to now having a functional application that can bring a lot of value,” Kjetil smiles.
Plugged into the source
We know you’re eager to hear about how they did it and what world of possibilities this can open for Equinor, but first there are a couple of things that quickly need some explanations and acknowledgments.
While this story focuses on Fo.tone and the team behind it, this is only one part of the Fiber Optic Data Pipeline that spans across different areas of Equinor: GBS IT, Drilling & Well, Research & Technology and Petroleum Technology.
The aim is to gather more data on how the wells flow and operate, for example how much oil flows into different parts of the well.
“Reservoir- and production engineers having access to this kind of data means they can optimize production in the wells. When every well produces for tens of millions every day, one can just imagine the potential impact. It is really exciting to lead the development of a solution with such significance.
Kjetil Tonstad

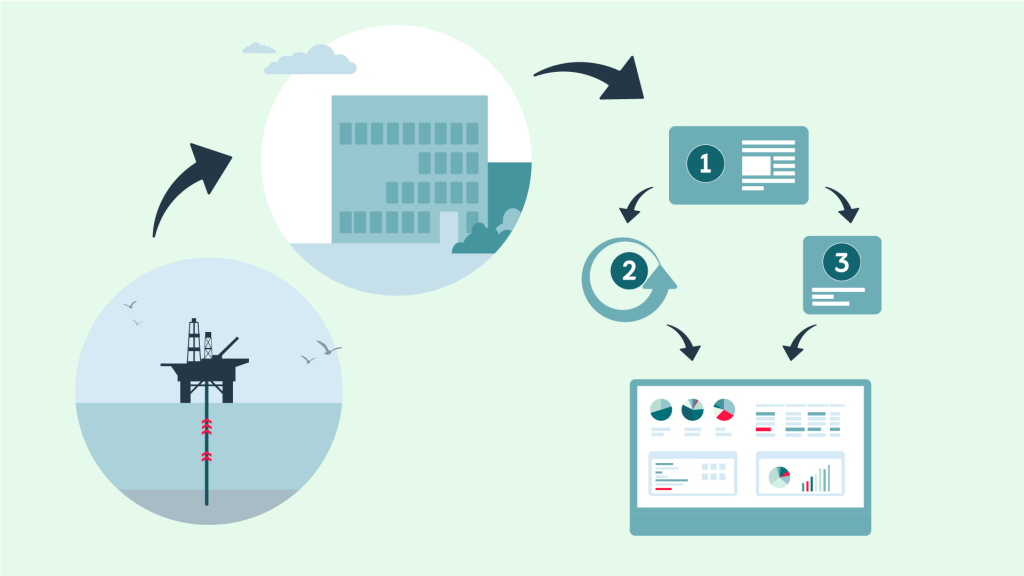
Our Drilling & Well teams have placed fiber optic cables alongside each Johan Sverdrup wellbore, which we can use as microphones. These microphones transmit the data equivalent of 10,000 Netflix movies each second onto a processing plant on shore.
Here, a data engineering team has managed to figure out how to process the data into a more manageable size while maintaining the main information content of certain aspects of the data.
These data are then sent to Fo.tone in real-time. The traditional way of doing this is to store the data on hard drives offshore, then flying them to shore by helicopter, and afterwards processing the data - which usually meant a 2–3-week delay.
Now, this entire operation takes less than two seconds from the sound being recorded to it showing in Fo.tone.
“The next step, which we already started, is analyzing the data further to see what we can learn and improve from it. Then we can continue to utilize machine learning to automate well operations and monitoring,” Kjetil explains.
See how sound travels into Fo.tone here:
Stay in the Loop
Breaking new ground
With the basics of what the Fiber Optic project tries to achieve out of the way, we can focus on the work done by the Fo.tone team and the first station is back-end.
In the beginning, the team had two main issues on their agenda. The first was being able to stream the data in near real-time, while the other was to make sure you could search and interact with the data in an efficient way.
“No one had done anything like this previously in Equinor, so we didn’t have any previous work to lean on. There was a lot of research, trial and error in the beginning.”
John Harald Brattåker, back-end tech lead
To find out, they didn’t just look for one example of an obvious solution and run with it - they started testing and trying different services.
“We are working in 2-week agile sprints, trying new things and improving on it constantly - which we still do,” John Harald says.
They soon landed on Azure Data Explorer as one of the key components for handling the large amounts of data, released by Microsoft only 6 months before they started.
“It’s a lot of fun to be able to experiment and learn like we have. Especially when you’re as interested in working with Azure, data engineering and big data as we are. We’ve been able to test things at a very early stage, which has been incredibly interesting,” John Harald says.
“The business area has had the same approach as well. No one really knew what the data would contain, where it could lead or what opportunities it had. It was really a big research project on both sides,” he adds.
Splitting data
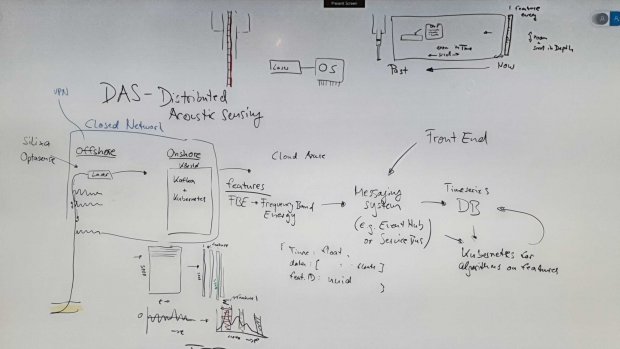
When data flows from offshore and onto land, it’s a matter of terabytes daily and there’s a lot of processing to be done before it arrives in Fo.tone. As soon as data hits land it’s processed & decimated and then sent into Azure to an Event Hub. From there, data is sent to Azure Data Explorer where it’s stored in order to do continuous queries.
“To be able to visualize the data to the end user with as low latency as possible, we decided to stream the data directly to the front end using Azure Service Bus. This means we can keep latency down to just two seconds from data being recorded offshore until it's shown in Fo.tone,” John Harald explains.
The way the Fo.tone team used Azure Event Hub and Service Bus in combination was new to everyone, even to its creators - which even led to the team giving presentations to Microsoft and presenting their use case.
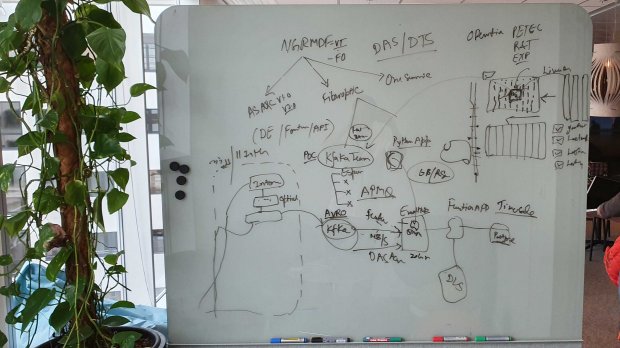
There are not only massive amounts of data coming in – there's also a variety of types of data. This meant the team had to figure out a way to make them manageable. The solution was to divide the data into “features”, depending on their properties.
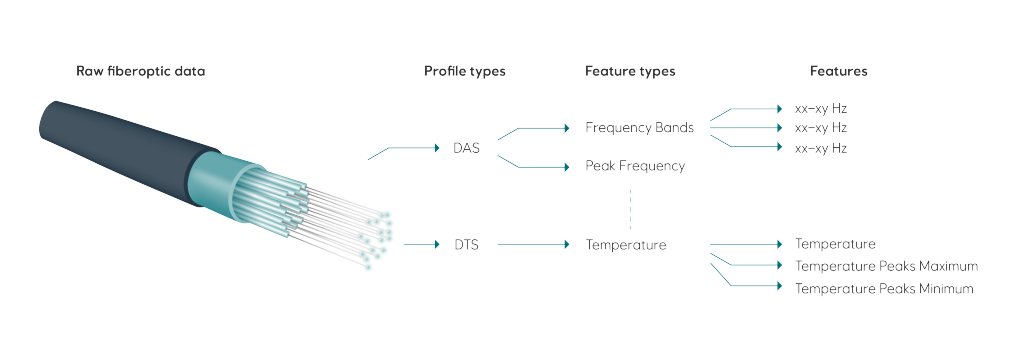
At first step, raw data is divided into profiles: Distributed Acousting Sensing (DAS) and Distributed Temperature Sensing (DTS).
“A profile contains information about the particular recording fiber and the recording configuration. They then group these in different types as the fiber requirements and/or the output from the interrogators are different,” John Harald says.
Each profile type contains one or more feature types, which then represent the kind of output that is generated from the profile output. For acoustic data, this may be frequency bands from the raw data.
“Within each feature type, we collect features which are the leaves of our data model tree. These represent the actual data that is stored in Azure and displayed in the heat map, such as a particular frequency band,” John Harald explains.
Profile types, feature types and features
Keeping latency down
One of the main driving forces for the back-end architecture was the front-end. The front-end team’s vision was to create a tool that worked a little like Google Maps: allowing users to view an overview of data and then zoom into the details.
“Making all of this data available for immediate queries and processing “on the fly” has been the biggest challenge. Keeping the latency down was crucial, since no one would want to use a laggy or slow software,” John Harald explains.
And the latency has been kept down, providing the 85 users with a quick and responsive front-end for them to dive into data.
“Now that we have the data available and visualized, we can continue working on finding areas of use for them. We’ve already created an app that “listens” to the data and lets us know when a valve opens or closes in near real-time,” John Harald says.
“Previously, this is something we wouldn’t have been able to directly measure until weeks after it happened. Now, we can know right away and help reduce the downtime for our wells."
John Harald Brattåker
Reducing downtime doesn’t just mean an increase in production - it also means more efficient wells with less emissions.
We have installed 150 kilometers of fiber optic strands at Johan Sverdrup alone.
Turning data-dense into responsive
When using the actual web app, you’ll be looking at the heatmap - something that looks more like 70’s wallpaper than data.
“This map is a key part of the application, allowing users to see - and listen to - what the fiber optic cables are picking up on, but that isn’t the only data you have access to,” front-end tech lead Frits Talbot tells us.
“Fo.tone also integrates production data, as well as apps that run on top of all these data, so it’s fair to say it's a very data-dense app. Finding a way to display all these different types of data in a way that made sense as well as being responsive is a real challenge,” Frits says.
“We wanted to make it responsive so that you could freely look up the data you need and personalize the app to your needs. Different types of users will look at different types of data, so it was a challenge to piece it all together.”
Frits Talbot, front-end tech lead
The team made it happen through the old-school tradition of brainstorming, but also by following certain design principles. One of them was Separation of Concerns (SoC). This is most apparent in the heat map component, which visualizes the acoustic data that’s live streamed into the front-end.
“This component was built from the ground up utilizing WebGL, as we were unable to locate an existing solution that fulfilled our requirements and could be extended in the directions we wanted to go,” Frits says.

For the MVP, getting basic frequency-band data navigation and visualization was the top priority.
These types of data came with their own sets of constraint, allowing them to make certain assumptions that simplified implementation and meant they could achieve the initial milestones without taking on too much at a time. While the algorithms were basic and lots of potential for improvement, the foundation was set.
"After passing the MVP stage, our former assumptions were relaxed, and optimizations and improvements were added. We also broke down modules and their responsibilities were made more explicit and limited, which makes the code easier to understand as you don't need to consider the whole picture," Frits explains.
“One module may be concerned with data storage and keeping it in sync on GPU, while others are focused on efficient data retrieval, visualization and so on. If something is wrong with one it doesn’t mean we have to change all of it, just that specific module."
Frits Talbot
Nothing is set in stone
Several of the modules for the heatmap became so generic that they were reused for other time-range-oriented features: observations (the data tagging tool), timeseries data (e.g. production data), the raw audio spectrogram display. This sped up implementation of those parts.
When making the transition to temperature data, which featured substantially relaxed timing constraints compared to acoustic data, they wrote a new data representation module. Then, they only needed to make minor updates to the visualization module to accommodate this.
“The loose coupling of the code brings it close to a plug-and-play architecture, where you just connect the appropriate parts you need for the type of data that is supposed to be displayed,” Frits says.
"Even though the code becomes more mature, this does not mean that we don't treat the code in any less agile manner than we did in the start. We consider little to nothing as set in stone, so we’re always open to new ideas, improvements and changes both big and small."
Frits Talbot
The amount of data sent from offshore to our processing plant equals 10,000 Netflix movies - each second.
Always learning
There’s little room for a one-trick pony when working on Fo.tone, and the team had to juggle a wide variety of skills; from data engineering and data science to signal processing and computer graphics knowledge.
“And within all these disciplines, we also had to figure out how to do these things in a web application, and how to best balance the work between backend and frontend,” Frits says.
“We quickly learned to process and deliver the raw data into audio for playback using the WebAudio API. Building on that experience, we used Web Workers to speed up computations (e.g. median filtering, STFT display) with parallel and asynchronous processing."
Frits Talbot
Fo.tone does have certain use cases clearly defined, but there’s still a lot of undiscovered potential in the data it provides and as such the team always focus on sharing knowledge and learning.
One time this approach proved useful was when they got a use case saying that users needed to be able to see different frequency bands at the same time.
“The heat map shows a single frequency band of sound at a time and the case was that they wanted to look at several of them at the same time, because different physical phenomena or events respond differently across the frequency bands,” Frits explains.
“My initial thought was that this would draw too much processing power from the browser, as well as create significant challenges with layout. Then I remembered coming across a concept named broadcast channels while studying the Mozilla Developer Network documentation,” he adds.
He investigated further and then suggested that taking this approach would be the way to go. Users would open the application in multiple tabs or windows, choosing different frequencies (or temperature) in each, finally linking their time and depth ranges.
The applications would now in effect be running as separate processes, allowing more efficient scheduling. Broadcast channels would then automatically be initiated between the application processes and messages would start flowing between them so that they could behave in concert.
“Then, as they zoomed or made changes to their selection, each of the maps would update themselves accordingly even if they were on separate screens,” Frits says.
“One of our users told us he has four separate screens connected and thanks to this approach he can use them with the browser still remaining responsive."
Frits Talbot
The fiber optic cables in the North Sea are so sensitive they could "hear" an earthquake in Turkey in 2020.
Dedicating time for competence sharing
Starting out, the team focused on learning and sharing competence within the team, but it didn’t stop there. This way of working has followed them since the start and is still a major part of work, developer Aisha Akram tells us.
“We always spend time on pull request reviews and have since the start. Not just as a formal thing that we must do, but we at times spend an entire day just on improving the code and working on pull request comments. There’s a lot of learning to be found by looking into the code."
Aisha Akram
Work is divided into two-week long sprints, but whenever they start on a new user story the team makes sure there is time specifically for “moral support” and pair programming.
“It’s in case you’re working on something you’re not familiar with, and means you have a given time to ask someone with more experience if you have any questions. This way of doing it has been efficient and helped us solve user stories much quicker than usual,” Aisha tells us.
There’s a lot to learn about all aspects of development and being a full stack team means they can even “switch” between the front and back-end if they want. This means that they’re always learning even if you’ve been working on the team since the start - or as a graduate.
“It’s a very complex application and the back-end part is almost like magic to me but as a graduate it’s an excellent team to learn from and be part of.”
Zuzanna Materny
She joined the team mere two months ago, and while she’s been working little on her own in order to get a feel for the project first - she’s now working on code by herself.
“It would have been really hard if I was left all by myself, but Frits, Aisha and everyone else will always help if needed. When I’m stuck, they’ll come up with a suggestion and it’s almost like a light bulb appears above my head,” Zuzanna laughs.
“I’m always learning something new when working on Fo.tone. In the future, there’s talk of implementing more machine learning tools on top of the data - which is something I’ve worked on during my studies. As a graduate it’s a great learning experience."
Zuzanna Materny
Hit the subscribe button below to stay in the Loop on all thing's software development in Equinor. That way you’ll have new stories flying into your inbox as soon as they’re published.
Until next time, stay safe and take care!
People

Kjetil Tonstad
Kjell Erik Reed Anda

Stefan Dümmong

John Harald Brattåker
Zuzanna Paula Materny
Ådne Elias Moldesæter
Frits Talbot
Javeria Habib
Aisha Akram

Bjørn Rosland
Related stories
Showing stories for