
Creating magic with machine learning
[Javascript] [PyTorch] [Amazon Web Services] [Nodejs] [Open Source]
It’s time to head under ground, to a world of rocks and solid stone. This story of machine learning begins with a tale of a geologist’s wish to make photographs of drill cuttings available to all.
Cuillin is the name of a tool developed by IT Software Innovation which uses machine learning to classify and label images of rock - without needing to manually look through it.
When Linn Arnesen, a former wellsite geologist, and now the Cuillin project manager, was shown a database from RockWash she saw great potential.
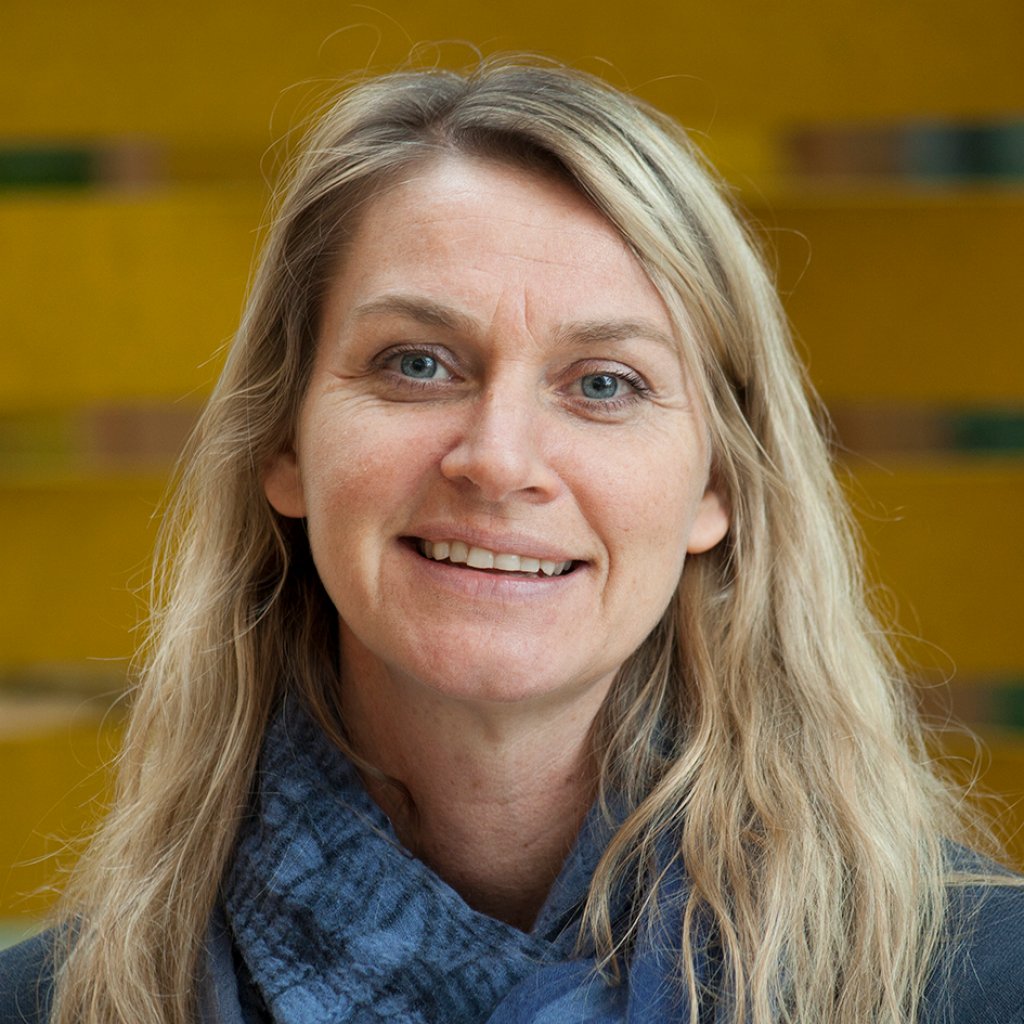
“The only one who gets to see the actual rock sample is the wellsite geologist present on the rig, the rest of us can only see the logs. But now with these photographs and Cuillin, everyone can see them, which is a great change.”
Linn Arnesen
Where do these pictures come from you ask? You might think that the rock and stone that Equinor drill through in search of new reservoirs is just discarded right away. But the samples of ground, called cuttings, are brought up with the drilling fluids, cleaned of mud and analyzed by the wellsite geologist.
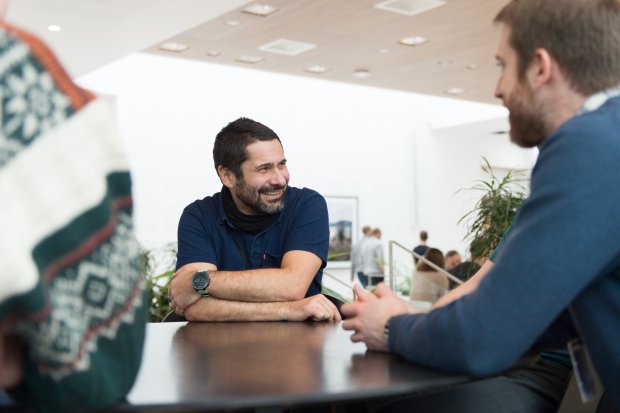
David Wade and Linn Arnesen tells us what Cuillin is all about.
Then, two things happen: one part of the cutting is put into a bag, while a smaller part is put on a tray and analyzed by a geologist. The bag is shipped off to a storage facility, where it spends its days resting on a shelf - never (or very seldom) to be looked at again. The smaller sample is thrown out after its been logged.
The database that caught Linn’s attention consists of these formerly shelf-resting bags of rock but they’ve been taken out of the bag, washed, dried and photographed.
“Cuillin is really about making pictures of the rocks that we are drilling through, and estimating all kinds of parameters from, available to everyone. This is truly an example of digitization,” Arnesen says.
Cuillin is part of a Digital Subsurface Strategic research project and one of many similar projects looking at all types of data - from cuttings and core to logs and seismic data. What all these projects have in common is a goal to generate new value and improve decisions quality through using digital capabilities.

Want to stay updated on Loop?

Between a rock and a hard place
But why would you want to go back and look at the rocks again? Arnesen explains that the logs created by the geologist can be affected by many factors.
“It’s easier to look at the bigger picture when we can look at the actual samples. We can check if our logs might be affected by external factors,” she says.
So, Linn came into contact with David Wade from IT SI Stavanger. He was already working on another deep learning project for Jens Grimsgaard in Research & Technology (R&T).
“I had been looking around for other potential data sources to use in deep learning and I started talking to Linn about what might be possible with this data,” Wade says.
The goal was to be able to take drill cuttings from new wells or areas they understood well, photograph them and from that photo be able to tell what the type of rock they’re drilling through is actually like. And how would they achieve that? Through using something called deep learning and deep neural networks.
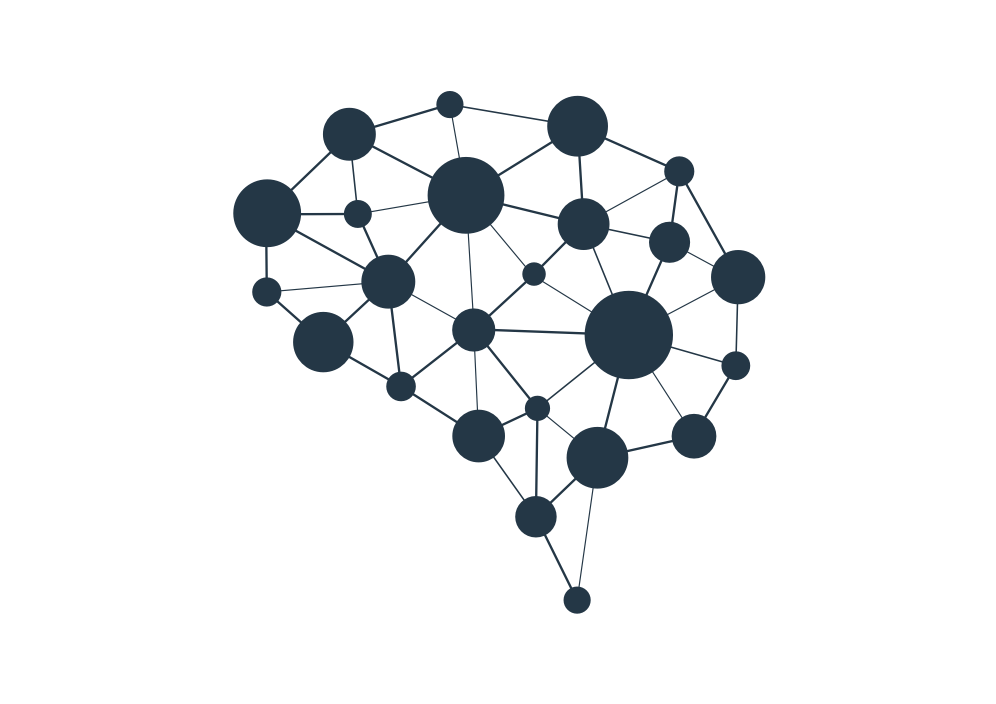
Mimicking the human brain
Not sure what deep learning and neural networks is all about? Then don’t worry, we got you covered. Deep learning involves feeding a computer system large amounts of known data, which it can then use to make decisions about other data. This data is fed through deep neural networks.
“Neural networks are a concept based on modelling the human brain and how the neurons function, and then implementing this in software. Basically, there’s two layers: input and output. In Cuillin’s case, the input is a photo and the output is the classification/labels it gives it."
David Wade
It’s kind of like the way we see the world. Whenever our eyes see a car, they send the image as input to our brain - which then tells us that it’s a car. Between these two neurons there are many “hidden” layers which consist of different boxes that we need to check, so that we know that it’s a car. Deep neural networks however, deal with large, complex datasets all at once - such as thousands of photos of different rocks.
“We train the network by showing it examples that we already know the answer to and bit by bit it’s able to learn from it. We’re able to adjust the numbers behind the algorithm so that it’s able to generalize things it hasn’t seen before,” Wade says.
Artificial neural networks 101
- Computing systems vaguely inspired by the neural networks in animal brains
- These systems “learn” by considering examples; generally without task-specific programming.
- Using a facial recognition network as an example, the network may learn to identify images of faces by analyzing images that have been labeled as “face” or “no face”
- With these results, the network identify faces in other images - without any prior knowledge about faces.
- The network evolves its own set of relevant characteristics from the learning material it was taught with
Training is key
Having to look at a vast amount of images of rock, classifying them and labeling them by hand doesn’t seem like the world’s most exciting job. Thankfully, it’s a task that a computer can do for us - as long as it receives proper instruction. Using the samples from RockWash, David picked out a few photos by hand that he thought fit into different categories and ran them through nVidia Digits, a prototyping tool.
“When I got what I thought were reasonably successful results I showed them to Linn and she thought they were quite successful as well. Then, when we got bigger data sets to train Cuillin with we spent some time working out how to get labels - the answers to train the network with. Once we found those we had to build a pipeline in to feed the algorithm,” David explains.
David explains how they trained the network.
They had to make sure that the network learned what it was supposed to be looking at, instead of other things that might be in the images. One of the main challenges when working with machine learning is that it's very, very good at memorizing things:
"If you show it a photo during training and then show it the same photo again, it will instantly recognize it - if it’s trained enough - even if it’s one in a million photos. The problem is when it starts looking at the wrong things.”
David Wade
As an example, David tells us about a network that was taught to label wolves and huskies from photos. In some of the instances where it was wrong it turned out the network had been looking at if there was snow or not in the photo - instead of the actual animal - to recognize the two.
“If photos are taken by slight variations, such as different lighting, the network can pick up on it and label it as something that you don’t want it to. It can also overfit completely,” he says.
But running a network of this scale is no simple feat. Thankfully, many networks for image recognition are available through open-source. Cuillin is currently running on one of the leading architectures.

Heaps of rock - but no rocky roads
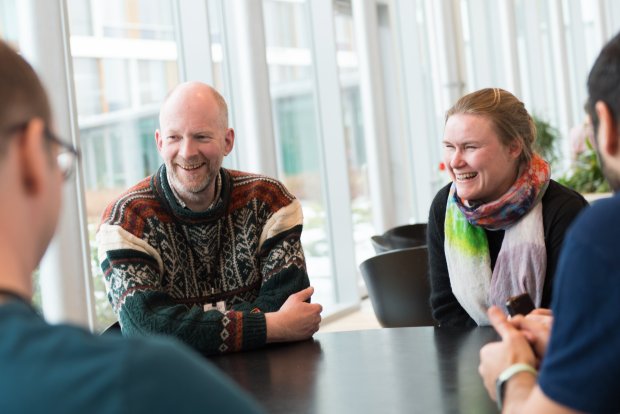
Work began in November 2017. Since then, Linn and David have been joined by four others; geologists Anne-Christin K. Ringdal and Ole Finn Tjugen, Raymond Wiker who is visualizing the hard facts, and Pier Lorenzo Parrachini from IT SI Stavanger. It’s a small group coming from very different areas of expertise, but it’s been a fun ride.
The team gathered for a workshop in Bergen on March 8. Ideas were discussed, progress was made - and quite a few laughs were had.
“We haven’t encountered any major obstacles and trying to have software developers and geologists working together has been a fun challenge. We’ve had a lot to learn from each other but I wouldn’t say that it’s been a challenge we couldn’t handle. It’s actually been quite fun to deal with,” David says.
“Both Raymond and I had to learn a lot about many different types of rock, how they’re formed, what their structure is and what they look like in order to classify the images. In the end we’ve probably trained the computer to be a better geologist than both of us,” David laughs.
"David and his team are doing things that were way beyond my first expectations," Linn says in this video.
Linn has served as the domain champion, answering David and Raymond’s questions together with geologists Ole Finn and Anne-Christin.
“When looking at the images you need to know what the different things in it are, which the IT guys don’t. I’ve learned a lot about programming even though I’ve never tried it before. Raymond and David have been explaining what the machines can do or not do, as well as asking us a lot about what we actually use the images and logs for. It’s been great fun,” Linn smiles.
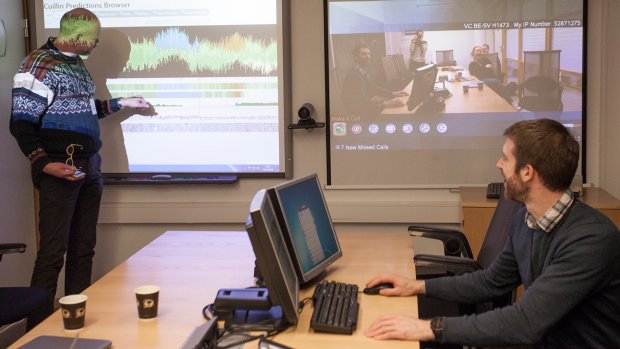
Visualizing the hard facts
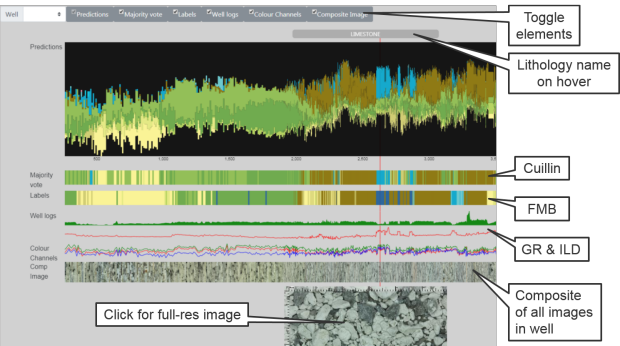
With all this data in hand, it’s essential to make it all available for the people who want to see it. Raymond Wiker has created a browser tool that lets David and the geologists view Cuillin’s findings. This allows them to compare Cuillin’s readings with the logs. They can even view each individual image that Cuillin has analyzed and labelled.
“The idea was first to automate the creation of graphs but along the way we’ve come up with new things to add, so that it’s a more complete tool. This makes it easier for them to validate the results from Cuillin’s readings,” Wiker explains.
The browser tool lets the viewer compare Cuillin’s findings with the logs from the geologist. A side by side comparison of two columns show what Cuillin found - and what the geologist found. When these differ from one another, it’s not a given that the geologist’s logs are the correct ones.
“Using this browser we can look at certain points in the output to determine if there’s a reason why Cuillin reaches a different conclusion. This is a reason to why we integrated the logs at all, it lets ut access more information to see if what we’re seeing is actually right,” he says.
Even though Cuillin is still at a starting point, both Linn and David are optimistic towards its future.
Linn is enthusiastic about Cuillins future and its many areas of use.
People

David Wade

Ole Finn Tjugen
Linn Arnesen

Anne-Christin K. Ringdal

Raymond Wiker

Pier L. Parrachini
Related stories
Showing stories for